Create basic jitter plot using ggplot2
Introduction
We will be creating basic jitter plot using ggplot2. We have already covered creating basic scatterplot using ggplot2 here
In scatterplots due to rounding the points overlap with existing data points. This is called overplotting. We can avoid this by adding noise in the data points and thus the points will not overlap. These kind of plots with noise are called jitter plots.
Procedure
We will be working with MPG data set present in-built in ggplot2. Few of the rows of the dataset are as follows:
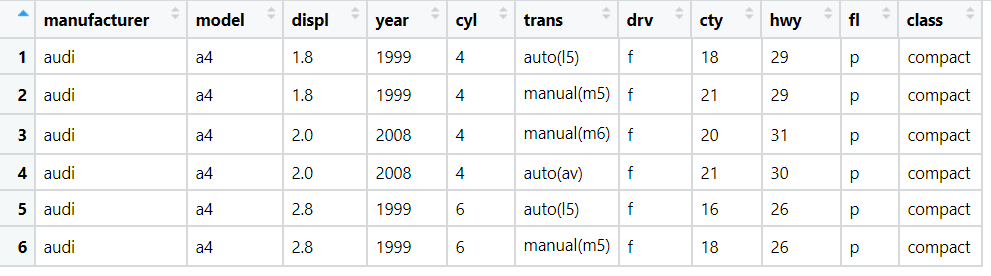
We will create basic jitter plot which plots the displ (engine displacement) column with the hwy(fuel efficiency on the highway) column.
Code
The code below creates basic jitter plot.
library(ggplot2)
# create basic jitter plot for displ and hwy columns
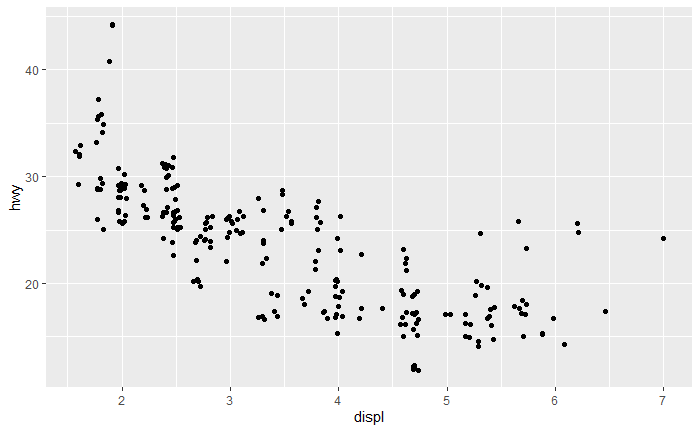
ggplot(data = ggplot2::mpg) + geom_jitter(mapping = aes(x=displ, y=hwy))And the output of above code is:
Conclusion
Thus we have successfully created basic jitter plot using ggplot2.
References
- https://ggplot2.tidyverse.org/
- https://ggplot2.tidyverse.org/reference/
- https://r4ds.had.co.nz/